Dr. Ronan Connolly (@1RonanConnolly) header
Dr. Ronan Connolly (@1RonanConnolly) profile picture

Scientist & environmentalist. Center for Environmental Research and Earth Sciences (https://xitter.twitterapi.xyz/t.co/waEQKdRncY) Publication list: https://xitter.twitterapi.xyz/t.co/4Yjpmzn6x7

Ireland
Joined April 2014
Photo by Dr. Ronan Connolly (@1RonanConnolly)Photo by Dr. Ronan Connolly (@1RonanConnolly)Photo by Dr. Ronan Connolly (@1RonanConnolly)Photo by Dr. Ronan Connolly (@1RonanConnolly)Photo by Dr. Ronan Connolly (@1RonanConnolly)Photo by Dr. Ronan Connolly (@1RonanConnolly)Photo by Dr. Ronan Connolly (@1RonanConnolly)Photo by Dr. Ronan Connolly (@1RonanConnolly)Photo by Dr. Ronan Connolly (@1RonanConnolly)Photo by Dr. Ronan Connolly (@1RonanConnolly)
In our latest COVID paper, published in the peer-reviewed Journal of Toxicology (a Wiley publication), we uncover how ramshackle and reckless "The Science ™" behind the novel "genetic vaccine" approach used for the COVID vaccines was. For this paper, we examined the journey of the modified mRNA technology starting with the manufacturing and testing stages. We then evaluated the real world effects from the subsequent roll-out to billions of people via COVID-19 vaccines. We discovered that, 5 years after this roll-out began, many important questions still remain unresolved about how this technology behaves inside the body, how it is manufactured, and how potential safety signals are investigated. We also document how, while most people who used these genetic vaccines seem to have been fine, from a pharmacovigilance perspective, an alarmingly high percentage of adverse events is associated with this technology - with a myriad of different ailments ranging from relatively mild/transient effects to serious, ongoing adverse events. This is a major concern not just because these vaccine-injured suffered (and in many cases, are still suffering), but because many groups are using the alleged "success" of the COVID vaccines to justify using the same mRNA technology for future applications. Links to (a) the full paper & (b) a press release summary are below 👇 P.S. While our review mostly focused on the mRNA vaccines (Pfizer, Moderna, etc.), some of the issues we identified were common to the DNA COVID vaccines (AstraZeneca, J&J, etc.)
1
1
6
201
Anika Sweetland grew up thinking the world was doomed to burn from climate change - as she & so many others had been taught. So, she studied climate science in university. Years later, she began to ask questions. As she pulled on thread after thread, everything began to unravel.
🚨 IT’S OFFICIAL! MY BOOK IS NOW AVAILABLE TO PRE-ORDER! 📚🥂 A LOAD OF BOLLOCKS? The Trillion Dollar Climate Scare At ten years old, I thought the Great Barrier Reef was going to die. At nineteen, I was getting drunk at university parties and telling handsome men that WE WERE ALL GOING TO DIE. (Surprisingly unsuccessful as a flirting technique.) I was so convinced the world was heading for catastrophe that I studied climate science, worked in government energy policy, worried myself sick about the future and even questioned whether it was ethical to have children. And then, one day, I started asking questions. What if everything wasn’t quite as I’d been led to believe? Twenty-seven years, a climate-science degree, an extraordinary amount of purple highlighter and one spectacular existential crisis later… I’ve written a book about it!!! It’s part memoir, part investigation, part comedy, and an occasionally outrageous journey through climate science, politics, money, fear and the extraordinary business of saving the planet. With a foreword by Princeton physicist Professor William Happer. And now YOU can read it! ❤️ 📖 PRE-ORDER YOUR COPY TODAY — LINK BELOW! 🔗 amzn.eu/d/0eJ3TzQH
3
4
121
Wow, so she came to fame through campaigning to boycott school as pointless due to climate change - and now she is campaigning for better schools? That's an interesting 180°↩️!
🇫🇷 Swedish activist Greta Thunberg has joined high school pupils campaigning for better learning conditions in France ahead of fresh nationwide demonstrations, with authorities and participants wary of further violence. ➡️ u.afp.com/SCYi
2
2
3
172
I only just found out today that @honestpollster was fired from Rasmussen Reports. In this video, Mark explains his side. Disappointing mistake by Rasmussen, but I wish Mark all the best with his new independent polling group. And I've just subscribed to his new Youtube.
I'm polling for the people. So the whole thing doesn't work unless I can talk to the people. Here is my story:
1
2
153
Thank you @CarmineCol55528 for sharing your independent confirmation of our discovery that when you convert almost any weather balloon sonde into a plot of molar density (D=n/V=P/RT, where R is the universal gas constant) against atmospheric pressure, you get 2 straight lines! 😀
Grok analyzes thousands of radiosondes to verify whether bilinearity is distorted by the tropical hotspot and/or the ozone hole... I'm not a scientist, but if these results are true, atmospheric physics should be rewritten according to Michael and Ronan Connolly!
2
3
10
2,867
In 2026, several people including yourself have all told me that they have been using AI to help investigate this phenomenon - and confirmed it. @Andy_May_Writer has already published some of his analysis (& provided code for others). But, a few others have also independently e-mailed me to tell me about their investigations. We had been trying to get people to look at this since 2014 but with little success. So, it is sad that Michael passed away (25/08/2025) just before the AI "vibe coding" revolution. But, I also know that he was confident that once people started to look, they would share our excitement at the discovery! So, thank you for letting me know! And for your kind words!
1
5
157
Interesting way of looking at it!
This remains the most profound meme I've ever seen.
1
251
I noticed last night that LIDL have launched two "new" chocolate bars. But, I'm puzzled... 🤔 Does anyone know why one of these "New" bars is the "Original" while the other is "Chewy caramel"? Can a chocolate bar be simultaneously "new" & the "original"?
199
Hits harder than a blues tune... 😉
2
14
2,527
It is still hard to believe that it is a year since my father, Dr. Michael Connolly, left us. The last year has personally been very busy for me, leaving little time for scientific research. But, one of our top priorities is writing up some of Michael's extensive body of unpublished research. In the meantime, if you're interested, this talk was recorded just 7 weeks before his unexpected passing. There's also a youtube version in the comments
Dr. Michael Connolly (1949-2025) Last month, my father, teacher, colleague and friend, Dr. Michael Connolly, passed away unexpectedly. (Part of why I haven't been online much lately). We are still coming to terms with this loss. But, my colleagues and I hope to contribute to his legacy over the coming months and years by writing up & finalising some of his extensive body of unpublished research. Some projects we were already preparing for publication, others were planned for later projects. One of the main research fields he was working on was using the world's weather balloon archive to study how the atmosphere actually behaves - as opposed to how current climate models and reanalysis models assume it behaves. This talk he gave on 5 July 2025 was his last public presentation and in it he gave an overview of some of what we have discovered so far.
6
1
15
4,763
In this talk, I discuss: 1) How little climate data there are before 1950s that isn't heavily contaminated by non-climatic biases (especially urban heat islands for the land data) 2) How the "temperature homogenization" algorithms used to 'correct' for non-climatic biases cause the "homogenized" data to seem more "homogeneous" but do so by spreading those non-climatic biases among all stations rather than removing them.
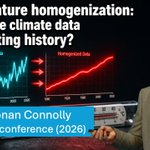
"Temperature homogenization": Fixing the climate data or rewriting history? This is the topic for the talk (39 minutes) I gave at @EIKE_KLIMA's 17th conference in Germany this summer. Youtube & Rumble links in comments below 👇 💠💠💠 Summary of talk Many people are initially surprised to learn that the temperature data used for calculating "global temperatures" has been artificially adjusted from the original raw data recorded by the weather observers. This often leads to a cynicism where people conclude the data is being deliberately "manipulated" to "add global warming". But, the original temperature records are plagued by "non-climatic biases" - changes in instrumentation, station moves, urban heat islands, and many others. So, many scientists believe that these "temperature homogenization" adjustments improve the quality of the data & using the original raw data will contaminate the temperature record with non-climatic biases. Meanwhile several "benchmarking" experiments using synthetic temperature records with deliberately added biases have shown the main temperature homogenization algorithms, including NOAA's "PHA" (Pairwise Homogenization Algorithm) are able to successfully remove most of the biases. However, in this talk, based on more than 15 years of scientific research with dozens of scientists around the world, I show how: 1) The available temperature data is remarkably limited before the mid-20th century, and is predominantly taken from European and N. American stations that are now urbanized for the land, with very limited and inconsistent sea surface temperature measurements for the oceans. 2) The only group explicitly attempt to correct for "urbanization bias" (a particularly insidious non-climatic bias that generally introduces gradual long-term warming), i.e., NASA GISS, developed a broken algorithm that doesn't work, usually leads to nonsensical adjustments, and indirectly adds warming to recent decades. 3) While NOAA's widely-used PHA automated homogenization algorithm does very well on synthetic temperature records, it fails miserably when applied to real temperature data. The adjustments applied to a given station record change wildly from day to day and rarely correspond to genuine documented non-climatic biases. 4) All of the current temperature homogenization algorithms are badly affected by "urban blending" where the urban warming of neighbours gets artificially "aliased" into the records of the homogenized rural stations. 5) When we look at the small subset of the data that comprises stations (a) with long records and (b) that are still rural, we find a more nuanced story that doesn't fit into the "CO2 is causing unprecedented global warming" narrative. Instead, we find that yes, it's warmer now than at the end of the 19th century, but that seems to be mostly a recovery from the Little Ice Age. The existence of the Little Ice Age can be seen from many temperature proxies as well as in the advances of glaciers across the world. 6) During the 20th century, we find a general alternation between periods of warming (1900s-1940s), cooling (1950s-1970s) and warming (1980s-present). When you look at the start date for most of the other instrumental "climate data" that we hear "confirms" the temperature record, you find that they only started in the 1950s (ocean heat content, weather balloons, etc.), 1970s (Arctic sea ice satellite data, satellite temperature data), 1990s (permafrost, ocean weather buoys), etc. The one exception to this is the so-called "sea surface temperature" and "marine air temperature" data. But, we find that most of this data is very limited before the International Geophysical Year (1957/58) and that it is even more plagued by non-climatic biases than the land record! E.g., the subset of data from "bucket readings" shows the opposite trend (warming) to those of the "engine room intake readings" (cooling) during the 1940s-1970s period. 💠💠💠 Links to the full talk in the comments. 👇👇
1
11
22
3,718
"Temperature homogenization": Fixing the climate data or rewriting history? This is the topic for the talk (39 minutes) I gave at @EIKE_KLIMA's 17th conference in Germany this summer. Youtube & Rumble links in comments below 👇 💠💠💠 Summary of talk Many people are initially surprised to learn that the temperature data used for calculating "global temperatures" has been artificially adjusted from the original raw data recorded by the weather observers. This often leads to a cynicism where people conclude the data is being deliberately "manipulated" to "add global warming". But, the original temperature records are plagued by "non-climatic biases" - changes in instrumentation, station moves, urban heat islands, and many others. So, many scientists believe that these "temperature homogenization" adjustments improve the quality of the data & using the original raw data will contaminate the temperature record with non-climatic biases. Meanwhile several "benchmarking" experiments using synthetic temperature records with deliberately added biases have shown the main temperature homogenization algorithms, including NOAA's "PHA" (Pairwise Homogenization Algorithm) are able to successfully remove most of the biases. However, in this talk, based on more than 15 years of scientific research with dozens of scientists around the world, I show how: 1) The available temperature data is remarkably limited before the mid-20th century, and is predominantly taken from European and N. American stations that are now urbanized for the land, with very limited and inconsistent sea surface temperature measurements for the oceans. 2) The only group explicitly attempt to correct for "urbanization bias" (a particularly insidious non-climatic bias that generally introduces gradual long-term warming), i.e., NASA GISS, developed a broken algorithm that doesn't work, usually leads to nonsensical adjustments, and indirectly adds warming to recent decades. 3) While NOAA's widely-used PHA automated homogenization algorithm does very well on synthetic temperature records, it fails miserably when applied to real temperature data. The adjustments applied to a given station record change wildly from day to day and rarely correspond to genuine documented non-climatic biases. 4) All of the current temperature homogenization algorithms are badly affected by "urban blending" where the urban warming of neighbours gets artificially "aliased" into the records of the homogenized rural stations. 5) When we look at the small subset of the data that comprises stations (a) with long records and (b) that are still rural, we find a more nuanced story that doesn't fit into the "CO2 is causing unprecedented global warming" narrative. Instead, we find that yes, it's warmer now than at the end of the 19th century, but that seems to be mostly a recovery from the Little Ice Age. The existence of the Little Ice Age can be seen from many temperature proxies as well as in the advances of glaciers across the world. 6) During the 20th century, we find a general alternation between periods of warming (1900s-1940s), cooling (1950s-1970s) and warming (1980s-present). When you look at the start date for most of the other instrumental "climate data" that we hear "confirms" the temperature record, you find that they only started in the 1950s (ocean heat content, weather balloons, etc.), 1970s (Arctic sea ice satellite data, satellite temperature data), 1990s (permafrost, ocean weather buoys), etc. The one exception to this is the so-called "sea surface temperature" and "marine air temperature" data. But, we find that most of this data is very limited before the International Geophysical Year (1957/58) and that it is even more plagued by non-climatic biases than the land record! E.g., the subset of data from "bucket readings" shows the opposite trend (warming) to those of the "engine room intake readings" (cooling) during the 1940s-1970s period. 💠💠💠 Links to the full talk in the comments. 👇👇
12
20
3
35
5,835
Climate activists are often accused of "virtue signalling". But, often they can be driven by what Zencey called "apocalyptic thinking". This was something he himself fell into as an ecologist. He described the birth of his daughter as the trigger that woke him up from it.
Eric Zencey (1988): "There is a seduction in apocalyptic thinking. If one lives in the Last Days, one's actions, one's very life, take on historical meaning and no small measure of poignance.” Source: Eric Zencey, Apocalypse and Ecology, The North American Review, Vol. 273, No. 2 (1988), pp. 54-57.
2
6
1
7
2,575
@LLBiggers, was it something similar for you?
91
Eric Zencey (1988): "There is a seduction in apocalyptic thinking. If one lives in the Last Days, one's actions, one's very life, take on historical meaning and no small measure of poignance.” Source: Eric Zencey, Apocalypse and Ecology, The North American Review, Vol. 273, No. 2 (1988), pp. 54-57.
1
2
1
4
2,669
The full 4 page article by Eric Zencey (1953-2019) which contains this quote was a very insightful essay written by an ecologist in 1988 who warned that he and his peers had fallen into this "apocalyptic thinking" & it was a mistake. Nearly 30 years later, his warning still holds.
1
3
4
199
FYI, this is the main reason I haven't been so active on X lately. 🙂
11
1
1
43
632
On a related note, "the Sea Peoples" are mentioned so many times throughout the film that Homer must have been a fan of Eric Cline's "1177 B.C.: The Year Civilisation Collapsed" bestseller from 2014. 🤔😲😉
Odysseus saying “our age of bronze is collapsing” was probably the stupidest line in the entire movie. It would be like a Medieval man saying “the Middle Ages are almost over”. Middle of what? It’s the PRESENT to them!!!
1
7
555
Henrik Svensmark on Cosmic Rays, Clouds and Climate 🧵 1/7 Last month, at the EIKE-17 conference in Halle, Germany, my colleague, Dr. Willie Soon, and I had the opportunity to talk to Dr. Henrik Svensmark about his research into the role of the Sun on the Earth’s climate. We also talked about the professional challenges Svensmark has faced because his findings are politically incorrect – including his recent firing from the Technical University of Denmark (DTU). Dr. Svensmark has been studying the influence of Solar activity on the Earth’s climate for more than 30 years. His research has had a different focus from our research into this subject – Svensmark is interested in the possibility that changing rates of cosmic rays could have a modulating effect on cloud cover – especially in isolated oceanic areas. But, like us, he has found that because his findings disagree with the narrative that humans are to blame for all climate change, his scientific work is treated as politically incorrect. So, we were interested to share notes with him. The full interview is 40 mins & I will provide links to it on Youtube/Rumble in the comments below 👇. But, in this 🧵, I thought I would share a few clips and summarise some of the key moments from the interview.
5
14
5
15
2,116
2/7 Svensmark’s Sun-Climate Theory Svensmark has spent more than 30 years investigating a chain of physical processes that he argues provides a specific mechanism by which solar activity can indirectly influence the Earth’s climate by slightly altering the cloud cover. It is known that high solar activity strengthens the solar wind, which reduces the number of galactic cosmic rays (GCRs) reaching Earth’s atmosphere. On the other hand, low solar activity weakens the solar wind and thereby increases the amount of cosmic rays reaching the Earth. Svensmark argues that these cosmic rays can help form cloud condensation nuclei (CCN) through ionization. He concedes that cosmic rays are just one contributing factor to cloud formation. But, he argues that it is a significant and real factor and that when there are more cosmic rays, this can significantly increase cloud cover - especially low-level cloud cover in isolated ocean regions. In general, more clouds makes the planet a bit cooler. So, he proposes that this can be an important driver of climate change: 1) Quiet Sun → Weaker Solar Wind → More Cosmic Rays → More Clouds → Global Cooling 2) Active Sun → Stronger Solar Wind → Less Cosmic Rays → Less Clouds → Global Warming In this clip, Svensmark explains the core mechanism.
1
3
149
For various reasons, the contiguous United States (all states except HI and AK) have the vast majority of the longest & most complete monthly temperature records in the global temperature datasets. E.g., this figure I generated in 2019 shows the distribution of stations available for every year since 1880. Some key points: 1) In 2018, there was indeed reasonably "global coverage" 2) But, in 1900, most of the available data was for the Northern Hemisphere 3) And specifically, the contiguous U.S. The disparity between the available long temperature records for US vs. rest of the world (ROW) is even more acute for the daily Tmin & Tmax data (as opposed to monthly Tavg data). The Tmax data has recently have received some renewed attention through the posts of @ChrisMartzWX & one naive critique of his analysis has been, "he's just looking at the US". Hopefully you now understand why - that's where the majority of the longest daily Tmin and Tmax records are. 4) A follow-up point that is not apparent from the attached figure is that the vast majority of long & relatively complete station records that are still "rural" today are also in the contiguous U.S. This is not clear from this figure, as for simplicity, I have plotted all stations (regardless of urbanisation). But, when you realise this, you can understand why those of us who are genuinely interested in trying to quantify the effects of urbanisation bias on the "global temperature data" will often focus on the U.S. It's not because we don't know that the U.S. is only a small part of the world. And it's not necessarily a US-centric view (I'm Irish and live in Ireland). It's because when you look carefully at the available data, the huge wealth of data for this one region and remarkable sparsity for the rest of the world makes it much easier to carry out detailed scientific inquiry. Note I emphasise the word genuinely in "those of use who are genuinely interested...". If your goal is to imply that urbanisation bias is a negligible problem, it is INCREDIBLY easy to do a sloppy scientific analysis to find your desired outcome. You just ignore all of the problems I've mentioned above and average together bad data without any care. 5) An additional problem that is more technical but also very serious is the statistical problem of "urban blending" that my colleagues and I described and demonstrated in detail in Katata et al., 2023 - a peer-reviewed article in the Journal of Applied Meteorology and Climatology titled "Evidence of Urban Blending in Homogenized Temperature Records in Japan and in the United States". This arises when groups blindly apply "statistical homogenisation" techniques such as NOAA's Pairwise Homogenization Algorithm (PHA) to all stations without subsetting the rural stations from the urban. With all of that preamble, I recommend reading the 🧵 below by @orwell2022. Focusing exclusively on the contiguous US (if you've read my preamble, you know why), he has sorted the longest station records from most urbanised (Q4-5) to least urbanised (Q1-2) & then calculated the US trends using each subset. Can you spot the differences? Do you notice how the trends of the least urbanised suggest an interesting alternation between warming and cooling periods over the last century? Do you also notice how NOAA's widely-cited "ClimDiv" estimate for US temperature trends matches better with the trends calculated from the most urbanised stations? 🟡🟡🟡 Finally, to wrap up, if you think that the many problems I've outlined above make things very complicated, then welcome to my world. If you think that it would be easier to ignore all of the above problems and just average together all the data (dodgy or not)... or even easier to simply assume that the various groups relied on by the IPCC "must already have figured this out", then you would be correct. It is much "easier". 🤷 But, also remember: Doing good science is hard. Doing bad science is easy.
1/ Can you see it? The national PHA-adjusted series (past cooled ~1°C) follows town sampling, not rural. Today’s still-rural historical sites are the control: their surroundings haven’t changed, so they measure climate, not real estate change. xitter.twitterapi.xyz/i/grok/share/9d3f4312b…
1
4
10
574
For various reasons, the contiguous United States (all states except HI and AK) have the vast majority of the longest & most complete monthly temperature records in the global temperature datasets. E.g., this figure I generated in 2019 shows the distribution of stations available for every year since 1880. Some key points: 1) In 2018, there was indeed reasonably "global coverage" 2) But, in 1900, most of the available data was for the Northern Hemisphere 3) And specifically, the contiguous U.S. The disparity between the available long temperature records for US vs. rest of the world (ROW) is even more acute for the daily Tmin & Tmax data (as opposed to monthly Tavg data). The Tmax data has recently have received some renewed attention through the posts of @ChrisMartzWX & one naive critique of his analysis has been, "he's just looking at the US". Hopefully you now understand why - that's where the majority of the longest daily Tmin and Tmax records are. 4) A follow-up point that is not apparent from the attached figure is that the vast majority of long & relatively complete station records that are still "rural" today are also in the contiguous U.S. This is not clear from this figure, as for simplicity, I have plotted all stations (regardless of urbanisation). But, when you realise this, you can understand why those of us who are genuinely interested in trying to quantify the effects of urbanisation bias on the "global temperature data" will often focus on the U.S. It's not because we don't know that the U.S. is only a small part of the world. And it's not necessarily a US-centric view (I'm Irish and live in Ireland). It's because when you look carefully at the available data, the huge wealth of data for this one region and remarkable sparsity for the rest of the world makes it much easier to carry out detailed scientific inquiry. Note I emphasise the word genuinely in "those of use who are genuinely interested...". If your goal is to imply that urbanisation bias is a negligible problem, it is INCREDIBLY easy to do a sloppy scientific analysis to find your desired outcome. You just ignore all of the problems I've mentioned above and average together bad data without any care. 5) An additional problem that is more technical but also very serious is the statistical problem of "urban blending" that my colleagues and I described and demonstrated in detail in Katata et al., 2023 - a peer-reviewed article in the Journal of Applied Meteorology and Climatology titled "Evidence of Urban Blending in Homogenized Temperature Records in Japan and in the United States". This arises when groups blindly apply "statistical homogenisation" techniques such as NOAA's Pairwise Homogenization Algorithm (PHA) to all stations without subsetting the rural stations from the urban. With all of that preamble, I recommend reading the 🧵 below by @orwell2022. Focusing exclusively on the contiguous US (if you've read my preamble, you know why), he has sorted the longest station records from most urbanised (Q4-5) to least urbanised (Q1-2) & then calculated the US trends using each subset. Can you spot the differences? Do you notice how the trends of the least urbanised suggest an interesting alternation between warming and cooling periods over the last century? Do you also notice how NOAA's widely-cited "ClimDiv" estimate for US temperature trends matches better with the trends calculated from the most urbanised stations? 🟡🟡🟡 Finally, to wrap up, if you think that the many problems I've outlined above make things very complicated, then welcome to my world. If you think that it would be easier to ignore all of the above problems and just average together all the data (dodgy or not)... or even easier to simply assume that the various groups relied on by the IPCC "must already have figured this out", then you would be correct. It is much "easier". 🤷 But, also remember: Doing good science is hard. Doing bad science is easy.
1/ Can you see it? The national PHA-adjusted series (past cooled ~1°C) follows town sampling, not rural. Today’s still-rural historical sites are the control: their surroundings haven’t changed, so they measure climate, not real estate change. xitter.twitterapi.xyz/i/grok/share/9d3f4312b…
1
7
13
790
On 26th June 2026, at the EIKE conference in Halle, Germany, we had the opportunity to meet with Dr. Henrik Svensmark for an extended conversation about his research. In this interview (40 min, links in the comments 👇), recorded with Dr. Willie Soon and myself, Svensmark discusses: 1) His physical mechanism linking cosmic rays to cloud formation. 2) His laboratory experiments and his real-world tests using Forbush decreases. 3) Limitations of current climate models in representing clouds. 4) Svensmark’s personal reflections on the challenges of independent research, including his recent firing from the Technical University of Denmark (DTU). Youtube & Rumble links below. 👇👇👇
6
11
25
1,814
I don't like Chris's use of the term "climate alarmist" as I've found labelling those you disagree with dismissive terms ("alarmist", "denier", etc.) just amplifies the problem of "us vs. them" echo chambers. But, otherwise, this is an important point by @ChrisMartzWX. Much of the global temperature data is "Tavg" which is the simple average of Tmax and Tmin. But, Tmax and Tmin can each be influenced by different factors, e.g., urban heat islands tend to have a much greater influence on Tmin than Tmax. So, averaging them together can often muddle together different trends. Unfortunately, most long-term temperature records don't have complete Tmin or Tmax records. But, the US temperature datasets have a lot of data for both Tmin and Tmax and the average of the two. And Tmax is the metric that most people think of when they think of "hot days". So, when Chris is presenting Tmax records for US stations, I agree it is very valid (once it is clearly labelled as such)! 👍
There's nothing that climate alarmists hate more than when I post graphs or graphics of daily maximum temperatures (Tmax). They will accuse me of “cherry-picking,” claiming that I need to look at the “average mean temperature” (Tavg) because that's where the real story is with regards to climate change. I have been researching / posting on climate change for almost a decade, and I am well acquainted with every trick they have in the book. And the reason why alarmists like Tavg over Tmax is because Tavg shows the big warming trends that suit their narrative while Tavg often doesn't on a station-by-station basis. But how is Tavg calculated, you might ask? Well, you take the daily Tmax measured that afternoon and daily Tmin measured that morning, add them up, and then divide them by two. Easy enough, this is just basic algebra in statistics 101. But Tmin values are highly contaminated by the urban heat island effect (UHIE). Surfaces such as asphalt, concrete, and brick have a high heat capacity and store more solar energy during the day than vegetation or bare soil. So, after sunset, this stored heat is released gradually, slowing the nighttime cooling of the urban environment. Buildings also inhibit a lot of that infrared radiation from making it back to outer space. Cities also tend to have more mechanical turbulence in the lower atmosphere because buildings increase surface roughness. In rural settings, the surface cools rapidly after sunset, but the air a few hundred or few thousand feet up doesn't. This causes what's called boundary layer decoupling, and leads to temperature inversions, especially in the fall and winter. But in an urban environment, buildings enhance turbulence and therefore vertical mixing, which brings warmer air aloft down towards the surface. Together, these prevent the air just above the ground from cooling as quickly at night, which the figure on the left shows. This effect is strongest when a site is first developed beyond pure wilderness conditions (so this affects rural and suburban environments too), but it has grown larger spatially across the global land surface because more land is being developed with time. This significantly affects Tmin trends, which is a significant (and perhaps the main) reason why Tmin (and by extension, Tavg) has gone up, at least in the mid-latitudes. In rural settings, Tmin is also affected by corn sweat (evapotranspiration off of corn that increases the vapor pressure; that is, the humidity, which means higher dew points and higher Tmin). On the right, I plotted the annual mean Tmax (red), Tavg (green), and mean Tmin (blue) for Huntsville, Alabama from 1920 to 2025. As you can clearly see, the annual average Tmax has not increased at all. The statistically significant increase in the Tavg, though, comes entirely from the even larger increase in Tmin, which is driven by the UHIE. And this is not just exclusive to Huntsville; you can see it in Fresno or Boston and virtually anywhere else that isn't purely rural and removed from cornfields. I like using Tmax because that value represents how warm (or hot) it actually gets (which is relevant to global warming) and, more importantly, it represents a well-mixed boundary layer where UHIE is minimized without having to adjust data using hypotheticals and curve fitting. Alarmists hate Tmax because it doesn't usually paint the picture of doom and gloom that gets people hype for their cause for political action.
6
7
1
19
1,803