

Digital Asset Research | Macro | Market Structure | 400K+ on YouTube | Part of MCO Global @moretradingonl
Joined September 2021
- Tweets38.8K
- Following1.1K
- Followers64K
- Likes52.9K




$BTC
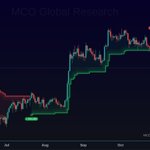
The daily Supertrend has been bearish since October 29. The line is at about $80,200 and keeps stepping lower. As long as Bitcoin trades below it, the short-term trend is pointing to the downside.
A daily close above that line would be the first sign of a change.

6
31
4,695
$BTC
Last week Bitcoin closed below its 50-week average for the first time since September. That line is at about $75,200 now and it is the first level to reclaim. Below price sit the 200-week average at about $68,000 and the weekly Supertrend at about $66,800, still bullish.

4
43
5,957
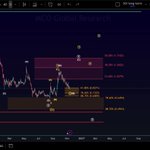
$SOL is testing the support zone at $70.16 - $94.42 and has reached the target zone at $76.76 - $87.77 inside it, but there is no sign yet that a low has formed.

3
63
7,055
$SUI is testing the 61.8% retracement at $0.827, one of the strongest Fibonacci levels, and without a reaction there, further weakness has to be expected.

1
35
6,651
$BTC
The daily Heikin Ashi candles have been red since November 6. But the candle bodies have shrunk from about $2,300 to about $900, and every candle has a lower wick.
Buyers are showing up at the lows. The first green candle would be the first sign that this move is ending.

$BTC
About 46% of this year’s Bitcoin volume was traded between $63,300 and $74,800, and Bitcoin is now inside that zone.
The price with the most volume in 2026 is at about $64,300. Between about $71,600 and $75,200 the volume is thin, so past trading offers little support there.

$BTC
The Donchian channel marks the 20-day high and the 20-day low. Since October 29 Bitcoin has made a new 20-day low on seven days, the latest on November 10.
A flat lower line would be the first good sign. Confirmation is a daily close above the upper line at about $82,000.

2
35
6,898
Most people skip this chart. I think it's one of the most important charts out there.
Tether's share of the crypto market keeps rising and just hit resistance at 7.28% to 8.57%.
Rising Bitcoin dominance plus rising stablecoin share is a weak mix for altcoins.
$BTC

Solana Just Hit Its Target. Is the Bottom Close?
$SOL
🤝 Paid partnership
$BTC remains under selling pressure below the 50-week SMA at around $75,500 and below the red line, which was former support.
On the daily chart, the rise from the July low is a 5-wave move, so the current pullback is seen as a corrective move within a larger recovery. As long as the support zone at $63,326 - $74,804 holds and a first local impulse forms, the price can move toward $100,000+.

$SOL
The area around $88 is the first resistance. The move up from the recent low is still too small to confirm a low. In the white scenario, wave (5) of circle wave C of wave b may have ended in the blue target area at $76.762 - $83.394.

The rarest death cross on the Bitcoin chart.
The weekly 50 average has crossed below the 100 only four times. Each time, a cycle low was close by:
April 2015: 14 weeks after the low March 2019: 11 weeks after the low September 2022: 10 weeks before the low July 2026: 11 days after the July low
In 2016, 2019 and 2023 the 50 crossed back above the 100 9 - 15 months later.
$BTC
