

Our World in Data is a free, nonprofit website with a mission to increase understanding of the world’s largest problems and drive informed action to solve them.
Oxford, England
Joined April 2015
- Tweets3.2K
- Following20
- Followers31K
- Likes472




What does poverty look like beyond income?
Someone can live above an income poverty line and still go without electricity, clean drinking water, or schooling.
The global Multidimensional Poverty Index (MPI), from the Oxford Poverty and Human Development Initiative and the UN Development Programme, counts the deprivations people face at the same time. We recently updated our 16 charts with the 2026 release, published in October, which adds new surveys for 13 countries.
The MPI looks at ten indicators in three areas, using data from household surveys: health (nutrition and child mortality), education (years of schooling and school attendance), and living standards (cooking fuel, sanitation, drinking water, electricity, housing, and assets). People deprived in a third or more of the weighted indicators count as “multidimensionally poor”. You can read more about how the MPI works in our article.
The chart shows this for Nigeria, which has a new survey from 2024. About half of Nigerians live in a household without electricity, about half in one without adequate sanitation, and more than three-quarters in one that cooks with solid fuels like wood or charcoal. 12% live in a household where a child has died in the previous five years.
(This data update was led by @parriagadap.)

Explore all of the updated data in our interactive charts: ourworldindata.org/search?da…

5
2,715
Global carbon dioxide (CO2) emissions from fossil fuels are projected to fall by around 0.4% in 2026. This is based on the latest preliminary estimates from the Global Carbon Project, published today.
This is a small reduction within an overall upward trend. Emissions have grown more slowly over the past decade than in previous decades, but they have not yet peaked or begun a consistent decline.
This fall mostly came from a reduction in oil consumption and a small decline in gas. Coal use increased slightly.
Among the major emitters, emissions are projected to fall in China, the United States, the European Union, and Japan. But they’re expected to increase by around 4% in India.
Why did emissions fall? The authors cite three key factors.
The deployment of clean energy (particularly solar and wind) displaced some fossil fuel use that would have otherwise been required to meet growing energy demand. Electric vehicles also reduced oil demand. Finally, the war in Iran and its impact on oil prices led to reduced demand, which has inadvertently reduced emissions.
Emissions from land-use change are more uncertain but are projected to increase this year due to peat fires and forest degradation in Southeast Asia.
(written by @_HannahRitchie and Pablo Rosado)

Explore new estimates for all countries for 2025, measured in total, per capita, and historical terms: ourworldindata.org/explorers…
Other sources & data:
globalcarbonbudget.org/
ourworldindata.org/electric-…
ourworldindata.org/grapher/c…

We have updated our topic page on migration!
Hundreds of millions of people live in a country that is different from the one where they were born. In some countries, the majority of the population was born abroad.
International migration can affect both the countries people leave and move to. For example, remittances (money sent back to family or friends by immigrants) can be an important source of income in their country of origin. In destination countries, migration can fill employment and skills gaps and contribute to economic growth.
But migration is also among the top concerns for the public in many countries. In politics, it is often divisive and controversial. People are often concerned about the effects on jobs and employment, public services, crime, and local culture.
Understanding these benefits and challenges requires us to first have a clear picture of migration itself. This page provides a starting point, with writing, data, and visualizations on the global scale of international migration.
On this new version of our topic page, we first look at the types of migration people often think of when the term comes up: irregular or illegal migration. We move on to international migration overall: residents, annual flows, and the number of asylum seekers and refugees. We then look at the demographics of migrants and the scale of remittances — money migrants send to their countries of origin.
(This topic update was led by @_HannahRitchie, @EOrtizOspina, and Tuna Acisu.)


Almost all the growth in global coal use since the late 1980s has come from China.
Outside China, the world’s use of coal has barely changed since the late 1980s. It was just over 20,000 terawatt-hours back then, and almost four decades later, it is still the same.
But the change has been very different in China. The country has increased the use of coal enormously, and today, China is burning more coal than the rest of the world combined.
The future of global coal use, and the emissions that come with it, depends heavily on what happens in China.
(written by @MaxCRoser)

How much deadlier and dirtier is coal than the alternatives? Find out in our article on the safest and cleanest sources of energy: ourworldindata.org/safest-so…

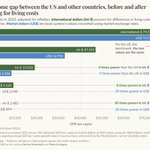
Much of the economic data we use to understand the world, such as the incomes people receive, is recorded in the local currencies of each country. On their own, numbers in local currencies tell us nothing about how they compare. One obvious approach would be to convert them into a common currency using market exchange rates. But this doesn’t give us the comparison we often look for: what money can actually buy in different countries. This is because the cost of living varies a lot across countries.
International dollars are a hypothetical currency that aims to have the same purchasing power everywhere. They are adjusted for differences in living costs across countries and price changes over time. Wherever it is “spent”, one international dollar buys the same goods and services as one US dollar would in the United States.
Making incomes comparable across countries matters especially for our understanding of global inequality. Using market dollars — local currencies converted to US dollars using market exchange rates — to compare incomes across countries understates people’s real income in countries where local prices are often much lower than in the US.
Take India, for example. Its gross domestic product (GDP) per capita is almost 30 times lower than that of the US in market dollars. But when we adjust for differences in living costs, the gap shrinks to about eight times lower. For Burkina Faso, the difference is even starker: its GDP per capita is 83 times lower than that of the US in market dollars, and 30 times lower after adjusting for differences in living costs. Global inequality remains large, even after accounting for what people can buy locally.


Population aging is pushing up Chile’s crude cancer death rate, even as age-adjusted rates are falling.
In Chile, the annual number of cancer deaths as a share of the total population has been rising for decades. From this, it would be easy to assume that cancer is getting worse. But the chances of dying from cancer at most ages are lower than they used to be. The missing piece is that the country’s population is changing quickly, and older people now make up a much larger share.
That’s what the chart shows. The crude cancer death rate, in red, counts registered cancer deaths per 100,000 people of all ages. This metric has been going up, reflecting the fact that cancer risks increase steeply with age, and the population has grown much older.
The blue line, by contrast, shows the age-adjusted rate. This metric removes the effect of aging by holding the age structure constant.
This line has been falling for decades, which means that Chileans at almost every age are now less likely to die from cancer than people of the same age were in the past.
The pattern we see in Chile is happening in many other countries, too, and is visible in the global estimates.
(written by @EOrtizOspina)

Explore this same comparison country by country in our interactive chart: ourworldindata.org/grapher/c…
Other sources & data:
ourworldindata.org/data-insi…
ourworldindata.org/data-insi…
ourworldindata.org/age-stand…
ourworldindata.org/data-insi…

6
3,200
Which vaccines do children around the world receive?
Every year, the World Health Organization (WHO) and UNICEF estimate what share of children in each country get each routine vaccine. Their Estimates of National Immunization Coverage cover vaccines against 13 diseases, from measles to rotavirus, in 195 countries since 1980.
They start from the doses that health services report and check them against household surveys. For the small share of countries that haven’t reported any data for the most recent year, WHO and UNICEF estimate coverage from the years before.
The chart shown here is about the vaccine against human papillomavirus (HPV), which causes nearly all cervical cancers. It shows the share of girls who had their last dose between the ages of 9 and 14, measured when they turn 15. Coverage varies a lot from country to country, even within the same world region.
We recently updated our charts with the July 2026 release, which adds 2025 estimates for every country. For HPV, we now have data for 160 countries and territories in 2025, compared with 146 a year earlier.
(This data update was led by Tuna Acisu.)

Explore all of the updated data in our interactive charts: ourworldindata.org/search?da…
4
2,860
Solar and wind power have grown quickly in Poland, but coal still dominates.
The share of electricity produced by solar and wind in Poland more than doubled in just four years. In 2021, these renewable sources produced just 11% of its power; by 2025, this had risen to 25%.
You can see this growth in the chart, based on electricity data from Ember.
Solar and wind output, combined, grew very little in 2025, due to weak wind conditions. Solar output continued to grow, but it was barely enough to offset the decline in wind power.
Poland still has one of the most coal-intensive electricity mixes in Europe, with coal producing 50% of its power. The country has committed to moving away from it in the next few decades; growth in solar and wind generation will play a key role in this.
(written by @_HannahRitchie and @parriagadap)

Explore energy sources across the world in our charts: ourworldindata.org/grapher/e…
Other sources & data:
ourworldindata.org/grapher/e…
ourworldindata.org/grapher/e…
ourworldindata.org/grapher/e…

7
2,917
📝 New article on Our World in Data: Around half of people will experience a mental health issue in their lifetime.
How many people struggle with mental health issues?
International and national health statistics will often give us estimates for how many people have depression, anxiety, or an eating disorder at any given time. But people can develop mental health disorders at any point in their lives, or experience recurring episodes over many years.
What share of people will ever experience one?
A study by John McGrath and colleagues tries to answer this question by drawing on data from 29 countries and over 150,000 people across the world. By interviewing people at different stages of life, they can build up an understanding of how this risk accumulates over an individual’s life course.
They estimate that roughly half of the population will experience one of 13 common mental health disorders by the time they reach 75.
Depression is the most common; by the age of 75, one in three women has experienced depression at some point in their lives. One in five men has.
For anxiety, the share is similar, as is the gender gap. For substance use disorders, it’s the opposite.
In this article, we look at these estimates in more detail and discuss why the true share might be even higher.

Read the article by @_HannahRitchie: ourworldindata.org/around-ha…

6
3,011
One in four people in the world is younger than 15. Just one in ten is 65 or older.
But there are huge differences in this distribution across countries. In the chart, we’ve shown these global figures alongside the country with the largest share of children, the Central African Republic, and the one with the largest share of older people, Japan.
In the Central African Republic, half of the population is under 15. Being over 65 is pretty rare: just 2% of the population.
Japan is the opposite. Being a child or adolescent puts you in the minority. Almost one-third of the population is 65 and older, and that share is growing quickly.
These differences in age distribution matter a lot for a country’s infrastructure, socioeconomic conditions, and public spending — from pensions and healthcare to childcare and education.
(written by @_HannahRitchie)

See how the age distribution of your own country compares to others across the world: ourworldindata.org/grapher/p…
Other sources & data:
ourworldindata.org/explorers…

Every year, over half a million women develop cervical cancer, and more than 300,000 die from the disease. These deaths are particularly tragic because we can prevent them through vaccination and early screening.
Because cervical cancer is caused by a virus — the “human papillomavirus” (HPV) — it can be prevented through vaccination. HPV vaccines are highly effective, as demonstrated in large-scale randomized controlled trials. Research shows that, if given early, vaccination reduces the risk of serious cervical cell changes by 99% for the HPV types most likely to cause cervical cancer.
In England, younger cohorts vaccinated at school show dramatically lower rates of cervical cancer than older cohorts when they reach the same age. In the youngest cohort, which had a vaccination rate of 89%, cervical cancer rates were around 87% lower than in the oldest cohort.
Yet HPV vaccination rates are low, or vaccines are unavailable in many countries. In many countries across Africa and Asia, HPV vaccines are not offered routinely at no cost at a national level.
Higher vaccination rates could prevent hundreds of thousands of cervical cancer cases every year. Researchers Kate T. Simms and colleagues estimate that 80% to 100% vaccination rates for both boys and girls, with catch-up vaccinations for adults, could prevent nearly 50 million cervical cancer cases by 2100.
By investing in vaccination and screening, the world could save hundreds of thousands of lives each year, prevent avoidable suffering, and make cervical cancer a disease of the past.

Read our article: ourworldindata.org/hpv-vacci…

How is life at different levels of GDP per capita?
The chart shows the relationship between GDP (gross domestic product) per capita — a measure of average incomes in a country — and people’s living conditions.
Where GDP per capita is higher, living conditions are far better in many ways. Where average incomes are higher, children die less often, fewer of them are born dead, mothers die less often, fewer children suffer from hunger, doctors can focus on fewer patients, people live longer, more people can read, children have better access to education and better learning outcomes, more people have access to electricity and clean drinking water, and people are happier with their lives.
The disparity between countries with a low and a high GDP per capita is enormous. Looking at the first panel, for example, you can see that a child born in one of the poorest countries is more than 20 times as likely to die as a child born in one of the richest.
(written by @MaxCRoser)

In Max's article, “What is growth?”, he wrote about why a high GDP per capita is so important for our living standards and how economic growth is possible: ourworldindata.org/what-is-e…

Tracking who trades with whom around the world.
The International Trade in Goods dataset from the International Monetary Fund (IMF) records how much each country exports to and imports from each of its trading partners. This data goes back to 1948.
Countries report to the IMF based on their own trade records and statistics. If this data isn’t enough, the IMF uses the country’s trading partners’ records instead.
This map shows, for each country in the world, the country from which it imported the most goods in 2025. For 83 of the 209 countries with data, that was China — this includes most of Asia, more than half of Africa, and most of South America. (Countries whose largest partner is not one of the most common ones are shown as “Other”.)
We recently updated eight of our charts with the IMF’s latest release, which adds data for 2025 for 209 countries and territories.
(This data update was led by @parriagadap.)

Explore all of the updated data in our interactive charts: ourworldindata.org/search?da…
4
2,975
In China, more than one in five workers is still employed in agriculture.
China makes and exports more goods than any other country. So, perhaps unsurprisingly, when we think about China’s economy, the first thing that comes to mind is often manufacturing — increasingly at the technological frontier in electric vehicles, batteries, and solar panels.
China’s position in manufacturing follows decades of economic transformation. The chart shows one aspect of this: the decline in agricultural employment.
At the turn of the 21st century, around half of all Chinese workers were employed in agriculture. One generation later, that share had more than halved, reaching 22% in 2025.
It's striking how far the share of workers in agriculture has fallen, and just as striking how high it remains. Agriculture employs more than a fifth of China’s workers, while accounting for less than 7% of its GDP.
(written by @EOrtizOspina)

Explore agricultural employment trends for all countries in our interactive chart: ourworldindata.org/grapher/s…
Other sources & data:
ourworldindata.org/grapher/s…
ourworldindata.org/grapher/a…

📝 New article on Our World in Data: How much development aid is spent on climate change?
For a long time, we didn’t have good data to answer this basic question. But using tags from the RioMarkers database, we’ve constructed a dataset on how much aid is spent on climate change, and what that funding is used for.
The headline result is that, in 2024, around one-fifth of development aid was climate-related. For allocable bilateral aid — that is, aid given from one country to another for specific projects — the share was one-third.
Some of that aid is given to climate mitigation projects, which aim to reduce greenhouse gas emissions. Some is given to adaptation: ways of dealing with the impacts of climate change. And just as much is given to projects that do both.
Whether climate-related aid is in conflict or crowds out other aid efforts is hard to untangle. When we look at individual examples, many look like traditional aid projects, with a subtle link to climate efforts. Take the building of a hospital in Tanzania; its main objective is to provide healthcare and save lives. But it’s also tagged as a climate-related project because it was built with energy efficiency in mind. Would that hospital have been built in a world without climate change? Probably.
Other cases are less clear. Concerns about the displacement of traditional projects seem real, but so too are concerns that commitments to climate finance are often met through a relabeling exercise.
In our article, we dig into the data on climate-related aid projects: how it’s changed over time and which countries give and receive it.


The world is getting more of its electricity from renewables but less from nuclear power.
If the world is to reduce its carbon emissions and tackle climate change, it needs to move away from fossil fuels to low-carbon power.
There are two key sources of low-carbon electricity: renewables — which include solar, wind, hydropower and others — and nuclear power.
While rapid growth in solar and wind has increased the amount of electricity coming from renewables, a lack of enthusiasm for nuclear means it’s playing a shrinking role in the global mix.
In the chart, you can see the share of global electricity coming from fossil fuels, renewables, and nuclear since 1985. Since 2000, nuclear and renewables have followed very different trajectories. Back then, both accounted for a similar share of global electricity. But in 2025, renewables made up more than three times as much: 34% compared to 9%.
The total amount of electricity produced by nuclear plants is about the same as it was two decades ago. But because the world produces much more electricity overall, its share of the electricity mix has declined.
(written by @_HannahRitchie and @parriagadap)

Explore the electricity mix of different countries: ourworldindata.org/grapher/e…
Other sources & data:
ourworldindata.org/grapher/e…
ourworldindata.org/grapher/e…
In the early 1980s, almost half a million people were paralyzed by polio every year. The number of cases has fallen by more than 99% from its peak, and foreign aid programs have played a crucial role in the fight against polio. What’s true for polio is also true for other diseases and essential resources like food.
These successes have been achieved with a relatively small amount of money. In 2023, the world gave around $240 billion in foreign aid. It’s a very small percentage of most rich countries’ economies.
More than 95% of foreign aid came from national governments in 2023. Just under $11 billion — or 4.5% of the total — came from private grants from philanthropic foundations. So if we want to see an increase in global foreign aid, building public support for more generous aid budgets from our governments matters a lot.
The UN has a target for developed countries to give 0.7% of their gross national income (GNI) to foreign aid. Only five countries — Norway, Luxembourg, Sweden, Germany, and Denmark — met this target in 2023. If all developed countries achieved this, we’d add an extra $216 billion to the pot, meaning the global aid budget would almost double.
If all donor countries were as generous as the most generous country — Norway, at 1.1% of GNI — the global aid budget would increase to around $700 billion. That means we could deliver up to three times as many polio vaccines, antimalarial bed nets, HIV treatments, and food packages as we currently do.

Read the article by @_HannahRitchie: ourworldindata.org/foreign-a…

We are a nonprofit, building Our World in Data as a public good that's freely available to everyone.
We just updated the list of people who have supported our work with a donation: ourworldindata.org/funding
We are very grateful to each of you. Thank you so much!

No matter what poverty line you choose, the share of the global population below it has declined.
The World Bank's International Poverty Line is an extremely low poverty line. Set at $3 per day, it draws attention to the living conditions of the poorest people on the planet.
In the chart above, you can see how the share below this poverty line has declined over the last generation. In the year 2000, 36% of the world’s population lived on less than $3 per day. In 2024, it was 10%.
But is progress against global poverty only happening when measured against such a very low poverty line?
The chart gives the answer. The entire blue line is below the entire dark red line. This tells us that no matter what line you choose, the share below it has declined globally.
Progress against higher poverty lines has been large, too. The share living on less than $5 a day has declined from 57% to 25%, and the share living on less than $10 a day has declined from 74% to 53%.
But on the right-hand side of the chart, we see that most people still live on low incomes: 81% of people in the world live on less than $30 a day, or about $900 a month.
(written by @MaxCRoser)

As Max Roser wrote in a short article, the history of the end of poverty has only just begun: ourworldindata.org/history-o…
