

MacroNerd | Investor | Founder @ Privacy-First Wealth Platform Institutional-Grade Charts & Indicators for Macro, Tech & Geopolitics. Updated Daily. Stay Ahead
Helping People Grow Wealth
Joined January 2026
- Tweets35.8K
- Following1K
- Followers3K
- Likes22K




Pinned Tweet
Rising oil prices are bad for your wallet, but historically?
They're actually great for your portfolio.
Everyone assumes that when oil spikes, the stock market tanks.
But data since 1986 shows the exact opposite.
The S&P 500 averages a higher return (13.1%) and a higher win rate (84%) in years when oil goes UP, compared to years when oil goes DOWN.
Just stay invested.

$NVDA may end up run by a finance exec or an Apple chip boss, not a GPU legend.
Colette Kress, Ian Buck and Apple's Johny Srouji are on a nine-exec shortlist. If that holds, expect Nvidia to tilt toward finance and ecosystem deals over pure chip wars.

Sixty-seven percent of $SPY stocks are above their 200-day MA.
Health Care leads at 92%, Energy lags at 52%.
What are you doing with that 67%?

High cash returns on real estate are usually a function of controlling initial capital deployed rather than exceptional property size. On the single property view in NetWorthNav, the tracker I built, the headline cash-on-cash return of 94.7% looks massive, but here is what it is actually made of.
Component 1: Cash invested of $30,000 out of pocket.
Component 2: Net monthly cashflow of $2,367, which equals $28,404 over 12 months at an occupancy rate of 100%.
Component 3: Operating yields on property value, showing a gross yield of 20.0% and a net yield of 18.9%.
These components do not simply add up because yield measures income against total asset value, whereas cash-on-cash return measures annual net cashflow against initial capital. The narrow gap between 20.0% gross yield and 18.9% net yield shows low operating overhead, which lets the $2,367 net monthly cashflow convert directly into a 94.7% return on the $30,000 cash invested.
When you evaluate your own income assets, is your return driven more by high net yields or by keeping initial cash invested low?

With Taiwan's chip tech in beauty care in focus, $SMH is up 6.6% to $515.32, about 14 times a normal hour's move.
The S&P 500 gained 1.5% in that window, so chips are driving this alone, leaving current holders just short of the 200-day average of $523.16.
Dow hit 11,722.98 on January 14, 2000.
It fell to 7,286.27 on October 9, 2002, 2.7 years later, a 37.8% drop.
It topped the high on October 3, 2006, 6.7 years after the peak and four years after the bottom.
Anyone could buy the bottom. Would you have held through those 6.7 years?

3
5
153
$BNO is up 1.3% as Brent crude futures rally.
Futures trade at $94.04 a barrel.
That's about 5 times a normal hour's move, 0.3% above its 200 day average of $93.74, despite Iran denying talks with Washington, a rare oil surge in a tech driven rally.
2
139
$RGTI took its steepest 2-hour drop since at least May 2026, down 11.2% from its high to -5.1% on the day at $11.53.
Semiconductors are up 5.2% today, so this heavy-volume selloff is all Rigetti.
It remains 30.9% below its 200-day average of $16.67.
Democratic gains in the US Senate have effectively neutered the threat of escalating tariffs, forcing Beijing to extend its suspension of retaliatory levies on American imports.
With Washington trade leverage blunted by midterm results, the trade war is entering a tactical pause.
• Beijing gains immediate breathing room by extending tariff suspensions on US imports and port fees while trade negotiations stall out. Washington loses its primary enforcement hammer as Congressional scrutiny curbs aggressive trade policy.
• Sanctions friction remains, with China warning of countermeasures after the US targeted two Chinese firms over Cuba ties. But both sides are choosing economic pragmatism over rapid trade escalation.
• Midwest grain farmers and US agricultural exporters gain as renewed Chinese purchasing targets American crops. Lower retaliatory farm tariffs directly protect livestock feed margins, keeping pork and poultry prices from spiking on retail store shelves.
The US Dollar Index ($UUP) is riding the outer ring of the radar, sitting at 102.93 at the very top of its 52-week range alongside a 21 point surge this week.
Into this policy shift, I would rather hold US agricultural exporter exposure than bet on further dollar momentum, and a fall in $DXY below 98.00 before Q1 2027 would prove me wrong.
Beijing will formally codify lower tariffs on US farm goods before Q2 2027 as political gridlock in Washington caps further escalation.
Every Wednesday: the macro radar, read in plain words.

Orlen cancels Qatar LNG deal, natural gas futures up 1.6% to $3.37, about 6 times a normal hour's move.
Gas sits 12% above its 200 day $3.00 average. Semiconductor stocks are up 4.6%.
Probably just a momentary wobble.
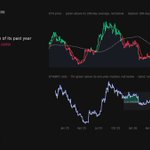
ethereum:native is actively starving the broader altcoin market of liquidity, keeping appetite suppressed until ratio momentum proves otherwise.
At $2,050.70, price has closed below the $2,255.60 20-day average for 7 days in a row, reinforcing a declining 200-day average at $2,150.84. The 14-day RSI reading of 30.0 is oversold, sitting at the 6th percentile of the past 12 months. Heavy momentum drives this drive lower, but oversold metrics inside a macro downtrend do not guarantee an instant turn.
The ethereum:native / bitcoin:native ratio at 0.0278 sits 19% of the way up its one-year range, positioned well below its 0.0299 median and down 7.0% over 30 days. Looking at the attached chart, the red fill across the bottom panel visually captures this regime shift below the median line. As the benchmark gauge for broad altcoin appetite, this sub-median ratio suggests the market lacks the fuel needed to rotate risk down the curve.
Into this print, I would rather hold bitcoin:native relative strength than attempt to catch an ethereum:native bounce. A sustained reclamation of the $2,150.84 200-day average would invalidate my bearish read.
Does ethereum:native reclaim $2,000 as support into the Sunday 15 Nov weekly close, or does ethereum:native / bitcoin:native test its 0.0258 yearly low first?

At the 46th percentile of its 12-month range, $SMH is up 4.7% in the last 14 hours pre-market.
The S&P 500 moved just 0.8% in that window, leaving chips running entirely on their own.
It remains below its 200-day average of $522.62.
$DVA just slipped 3.4% to $179.28, barely touching its 200-day average.
A hair below the line after nine months above, no big deal yet, but a warning flag.

Nasdaq futures posted the largest overnight move with a gain of +1.4% ahead of an empty US calendar.
Gold rose 0.6% while Brent oil also gained 0.6%.
S&P futures added 0.5% across the same stretch.

$CRWV up 4.3% in the last 2 hours, +2.3% on the day, now at $50.10.
That's about 7 times a normal hour's move after-hours with earnings in focus.
It's recovering from this morning's low.
Monthly net-worth reconciliation on the first of each month
Everyone wants rapid portfolio turnover or the next hot crypto. This did more:
- It forces every inflow and outflow onto the same timeline, so small changes compound
- It reveals hidden debt impact, letting you adjust assets before they erode returns
The screen shows net worth $764,043, target $500,000 reached (100%), investments $386,000 across three portfolios with +19.0% average CAGR, and real-estate value $570,000 across four assets delivering $70,200 annual cash flow
Which single monthly figure will you start recording tomorrow, net worth, investment balance, or property cash flow?


Core CPI printed at +0.3% for October, the same as last time, while headline CPI came in at +0.4%.
Bitcoin saw the biggest move relative to its usual size at -0.83%, while the US dollar index was the quietest at +0.23%.
S&P futures dropped 0.66%, compared to an average move of 0.28% in the release hour over the last 8 releases.

bitcoin:native is not in a bull run. It is in a dead zone.
Day 934 post-halving is a graveyard. The 2016 and 2020 cycles peaked on days 525 and 546. We are 400 days past the top. The 20-day moving average sits at $78,067, pressing down on price for six straight days. This is a trap.
The RSI is 34.5. That is weak, not oversold. It signals fatigue, not exhaustion. Most traders are still chasing the 200-day moving average trend, which is rising. They are staring at the bottom of the chart while the top is already gone.
Look at the attached chart. The line is green. That means the Mayer Multiple is 1.01. That is cheap relative to the 200-day average, but it is a warning, not a buy signal. In 2017, the peak Mayer Multiple was 3.74. In 2021, it was 1.48. We are nowhere near those extremes. We are drifting.
The 200-week moving average is at $67,764. Price is only 9% above it. Past cycle lows formed near this line. This is the floor, not the base.
I would rather own ethereum:native than bitcoin:native right now. I am wrong if bitcoin:native holds above $67,764 for two consecutive weeks.
Is your 200-day moving average a buy signal or a lagging indicator?

Options price a 0.8% move for the S&P 500 today, with October CPI out at 8:30 AM New York time.
After a print above the previous one 8 of the last 21 times, S&P 500 futures averaged +0.10% in that hour. After a print below it 13 of the last 21, they averaged +0.19%. Both are small next to the 0.8% the options price.
My call: core CPI comes in below +0.3% for October.
