
This Veterans Day, we honor all veterans who have served our nation, including those who are part of the USGS team, and thank them for their service.
Through their work at the USGS, they continue to contribute to public service and our understanding of the world around us.
Thank you to all who have served.
📸 1: Laura Lapolice, USGS hydrologic technician, served four years on active duty in the U.S. Navy as a Seabee, with deployments to Japan, Indonesia and Afghanistan. In this photo, she measures a record-high flow of 72,000 cubic feet per second at the Broad River near Blacksburg, South Carolina, following Hurricane Helene.
📸 2: Camille Hopkins, USGS Wildlife Disease Research Coordinator, served 10 years in the U.S. Army Reserves as a Veterinary Corps officer. During her service, she cared for military working dogs and ensured the safety of the food supply for military personnel at home and abroad. In this photo, Dr. Hopkins is holding a red morph Eastern screech owl (Megascops asio) that was caught in a bird mist net in Jefferson National Forest, Virginia.
📸 3: Trevor Needham, Supervisory Hydrologist, entered the U.S. Army in 2006 as a Second Lieutenant and served on active duty until 2014. He continues to serve in the Army Reserves as a Lieutenant Colonel Engineer Officer. In this photo, he wears protective gear while collecting samples in the Baltimore sewer system for a contaminant source tracking study.
📸 4: Sean Patton, USGS hydrologic technician, served in the U.S. Marine Corps infantry from 2005 to 2009, primarily with the 3rd Battalion, 8th Marine Regiment, based at Camp Lejeune, North Carolina. In this photo, he performs maintenance and calibration checks on a multiparameter water-quality sonde at Box Canyon Spring near Wendell, Idaho.
USGS Awards $1.7 Million to 26 States to Preserve Data for Energy, Groundwater, Minerals Exploration
Learn more 👉 ow.ly/Tx2G5105wK6
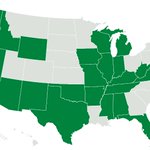
📸: States that received grants are Alabama, Arizona, Arkansas, California, Delaware, Florida, Idaho, Illinois, Indiana, Iowa, Kentucky, Michigan, Mississippi, Missouri, Nevada, New Hampshire, New Mexico, Oklahoma, Oregon, Tennessee, Texas, Virginia, Washington, West Virginia, Wisconsin, Wyoming.
USGS retweeted
Kīlauea Volcano Update 🌋 🚁
Scientists on a mapping overflight at the summit of Kīlauea in Hawaiʻi Volcanoes National Park the morning of November 4, 2026, observed roiling lava ponds in both of the eruptive vents.
⬆️ North vent's lava pond was about 100 feet (30 meters) across
↙️ Southwest vent's elongate lava pond was about 130 feet (40 meters) long by 65 feet (20 meters) wide and the surface was about 65 feet (20 meters) down within the vent
Since November 2, lava has overflowed from these vents intermittently, with strong glow lighting up the summit overnight. Volcano monitoring data indicates that episode 56 of lava fountaining is possible between now and November 8. No unusual activity has been detected outside of Kīlauea summit region.
🎥: Views of Kīlauea summit taken during a USGS Hawaiian Volcano Observatory monitoring overflight the morning of November 4, 2026.
#Kilauea #VolcanoUpdate #Lava
What can something smaller than a grain of sand reveal about Earth's past?
Meet pollen and spores, tough little grains built to survive. These microscopic structures are produced by plants as part of their reproductive cycle. Once they are dispersed by wind, insects, or other means, they can settle into sediments and remain preserved for thousands or even millions of years. The oldest known land plant spores date back about 480 million years, and pollen from flowering plants has been found in rocks at least 125 million years old.
So how does pollen help us understand climate?
Because plant distribution is shaped by temperature, moisture, and other environmental conditions, the pollen preserved in a layer of sediment acts like a snapshot of the vegetation (and climate) that existed when it was deposited. Scientists study these fossil grains to reconstruct patterns of past vegetation and piece together how climate has shifted over time.
These records, combined with modern measurements, show past climate conditions across timescales, from year-to-year variation to fluctuations spanning millions of years. USGS paleoclimate scientists use evidence from pollen, ice cores, tree rings, marine microfossils, corals, and isotopes to characterize past environmental conditions, helping researchers improve climate models, predict changes in the water cycle, and anticipate future shifts in El Niño and La Niña patterns.
This understanding of ancient climate also informs real-world decisions, from assessing how sea level rise might affect coastal fishing industries to evaluating how shifting vegetation could shape future agriculture.
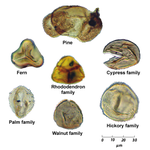
📷: Pollen and spores preserved in sediments. Credit: USGS
#paleoclimatology
USGS retweeted
One of the densest concentrations of geysers in Yellowstone can be found in the remote Shoshone Geyser Basin, on the west side of Shoshone Lake. We visit the area in the latest Yellowstone Volcano Observatory monthly video update.
youtube.com/watch?v=tLzsNOh6…
Shoshone Geyser Basin is one of the most spectacular in all of Yellowstone National Park. Located deep in the backcountry along the west side of Shoshone Lake, the area has one of the densest concentrations of geysers, second only to the Upper Geyser Basin (where Old Faithful is located). There are over 100 geysers in this region and 40 or 50 might be active at any given time. A trail takes you right by Minute Man geyser (always at the ready!), so it is quite easy to watch the frequent eruptions there.
During the month of October 2026, the University of Utah Seismograph Stations, which monitors and operates the Yellowstone seismic network, located 66 earthquakes. The largest was a Magnitude 2.0. Throughout 2026, there has been very little change in ground deformation—neither uplift nor subsidence. Steamboat Geyser had minor activity. Echinus Geyser erupted on October 26. Giant Geyser, in Upper Geyser Basin, erupted on October 5, 13, and 22. Yellowstone volcano remains at normal, background levels of activity.
@YellowstoneNPS
USGS retweeted
Trick or Hydrological Treat? 👻🍬
Water science can get incredibly weird. From rivers flowing backward during historic earthquakes to Antarctic glaciers that look like they're bleeding, nature writes the ultimate spooky stories.
👻 When rivers run backward
🍬 It sounds like a glitch in the matrix, but powerful events can reverse river currents. In 1811-1812, the massive New Madrid earthquakes caused parts of the Mississippi River to temporarily flow backward. More recently, intense storm surges from some major hurricanes, like Hurricane Laura in 2020, have forced coastal rivers to reverse course for hours!
👻 The glacier that bleeds
🍬 Located in Antarctica, "Blood Falls" looks terrifying, but it’s pure geochemistry. Beneath the glacier, an iron-rich lake is trapped and cut off from sunlight and air. When the iron-rich water exits the ice, it reacts with oxygen in the air and turns the water red, similar to how rust is formed.
👻 The sound of flowing water
🍬 Our streamgages don't scream, but they do use sound! Scientists use instruments like Acoustic Doppler Current Profilers (ADCPs), which bounce high-frequency sound waves off particles in moving water. By measuring how the pitch changes (the Doppler effect), we map how fast a river is moving - no spooky screaming required.
Happy hydrologic Halloween! 🎃🦇
📷 1: A foggy, early morning view looking down the Gibbon River, off of Grand Loop Rd in Yellowstone National Park, Wyoming. Credit: USGS
📷 2: A USGS hydrograph of discharge on the Neches River Saltwater Barrier at Beaumont, Texas during Hurricane Laura in August 2020 displaying flow reversal. Background image: An oxbow of the Neches River in Big Thicket National Preserve just upstream of Beaumont, TX. Credit: National Park Service
📷 3: Blood Falls at Taylor Glacier in Antarctica. Credit: Peter Rejcek, National Science Foundation
📷 4: A USGS hydrologic technician takes a flow measurement on the South Umpqua River at Melrose, Oregon. Credit: USGS

ALT Foggy river scene with evergreen trees and rocky banks, overlaid with the phrase "Trick or Hydrological Treat?"

ALT A USGS hydrograph displaying discharge at Neches River Saltwater Barrier at Beaumont Texas in August 2020 during Hurricane Laura. A blue line peaks sharply around 12,000 cubic feet per second, then drops sharply below zero to negative 7,670 cubic feet per second. A large black arrow points to the lowest valley of the curve, labeled with bold text reading "Flow reversal." Background photo shows a muddy river and green trees.
Meet Annautaq, an orphaned Pacific walrus calf whose unexpected discovery during USGS research in Alaska saved his life.
Last month, USGS biologist Tony Fischbach and Violet Anniskett, an Illisavik College intern, were surveying a beach after a storm moved a walrus herd from the area. While sampling carcasses for a study on harmful algal toxin levels in Pacific walruses, Violet discovered a live, orphaned calf hiding between two adult carcasses.
With approval from the U.S. Fish and Wildlife Service (USFWS) and the local Iñupiaq community, the pair cared for the calf for nearly four days. They dispersed the gulls scavenging him, walked a half mile to the nearest shelter (an abandoned building open to the elements), and protected him from polar bears until the storm passed and a local rescue team could boat him across the lagoon. From there, Alaska Sea Life Center (ASLC) vet techs crated him onto a small plane to rehabilitation. Violet joined the journey to ease his transition.
Violet grew up near walrus herds and first joined USGS surveys on a high school class field trip. This September, she joined the USGS team to gain professional experience working with the wildlife central to Iñupiaq culture. Her community agreed to have the orphan saved with the condition that they name him to preserve their connection to him. Violet chose Annautaq, an Iñupiaq word meaning axe, in honor of her father’s Iñupiaq name.
USGS scientists monitor Pacific walrus populations in support of Marine Mammal Protection Act reporting and management requirements. This work depends on partnerships with Alaska Native communities, whose generational knowledge shapes how we understand and protect these animals.
After rehabilitation at the ASFC, Annautaq has moved to his long-term home, where he will serve as a species ambassador, helping people learn about walruses and their connection to Alaska's people and changing marine environments.
All work was conducted under USFWS permit MA3376D.
📷1: Violet and Annautaq.
📷2: Annautaq gazes out the shelter window.
📷3: Tony and Annautaq.
📷4: Violet resting with Annautaq.
Credit: Tony Fischbach, USGS
What can lava samples tell us about Kīlauea’s recent summit lava fountains? 🌋
Since the current eruption began in late 2024, scientists with our USGS Hawaiian Volcano Observatory have analyzed 178 lava samples from episodes 1–39 to better understand the magma feeding the eruption and changes occurring beneath the surface.
Here’s what they found:
💠 Variations in fountain height and episode duration are not associated with significant compositional changes
💠 The eruption is fed by lava from the magma chamber that is about a mile (1–2 km) beneath Halemaʻumaʻu
💠 There is evidence that the parts of former lava lake eruptions in Halemaʻumaʻu (between 2020–2023) remain molten below the surface and sometimes influence the chemistry of material erupted by lava fountaining
💠 A subtle change in chemistry suggests that a new magma was erupted within a few weeks of the eruption onset
💠 Kīlauea’s shallow magma storage system beneath Halemaʻumaʻu showed an increase in temperature through fountaining episodes 1–39
Together, these findings offer new clues about the magma system driving Kīlauea’s ongoing eruption.
Read the full article: ow.ly/QTKB5101RA0
📷1-2: A scientist collecting fresh lava samples from the Kilauea.
📷3: Analyzing lava samples in the lab.
📷4: An annotated image of a lava sample under a microscope.
@USGSVolcanoes
500 million years of Earth’s history are written in the rocks of the Sierra Nevada. 🗺️⛰️
The Sierra Nevada is one of the most iconic landscapes in the western U.S., a major mountain range stretching north to south along eastern California and into a small portion of western Nevada. Its rocks hold a story that spans more than 500 million years.
Now, the Sierra Nevada Earth Science Atlas brings that story into sharper focus.
Created through a collaboration between the @CAGeoSurvey and the USGS, the Atlas provides the most detailed geologic framework of the Sierra Nevada to date. Why does that matter? Detailed geologic maps help scientists and resource managers understand what lies beneath the surface, from the rocks and faults that shape the landscape to the mineral resources and geologic processes that affect the region.
From ancient ocean deposits and volcanic islands to massive mountain-building events, erosion and glaciation, the Atlas captures the geologic processes that shaped the Sierra Nevada we see today.
This initial release features a geologic map and descriptive text, with more components of the full Atlas coming soon. Upcoming map layers will depict carbonate rocks, fossils, metallic mineralization regions, and geochronology data, along with an associated report.
Explore the Atlas 👉 ow.ly/HXwc5101rgf
📽️ Video consisting of several clips of the Sierra Nevada Earth Science Atlas. The video pans and zooms across the map to show different geographic and geologic features. The video includes close-up views of map details, the legend, and the entire atlas.
Ready to go batty? 🦇 Celebrate Bat Week with a few fun facts about these nighttime flyers!
🦇 Bats eat – a lot! A single little brown bat, which has a body no bigger than an adult human’s thumb, can eat 4 to 8 grams (the weight of about a grape or two) of insects each night. Others feed on feed on fruit, nectar, or pollen.
🦇 Bats are not blind. They have small eyes with very sensitive vision, which helps them see in conditions we might consider pitch black.
🦇Bats are important pollinators. More than 300 species of fruits and plants rely on bats for pollination and seed dispersal. Bats are significant pollinators to cacao, the key ingredient in chocolate.
🦇Not all bats hibernate. In winter, bats either hibernate or migrate to warmer areas. One hoary bat GPS tagged by USGS scientists traveled from Marin County, California to southwest Idaho!
🦇 Bats make up one-fifth of all mammalian species worldwide and are found on every continent except Antarctica.
📷1: ‘ōpe‘ape‘a (Hawaiian hoary bat) - The only land mammal native to the Hawaiian archipelago that still exists today. They prefer coastal lowlands during breeding season (May to October) and move to interior highlands in winter. They feed on insects and roost in trees. Credit: USGS
📷2: Spotted Bat – One of the few bat species whose echolocation frequency is low enough for humans to hear. Little is known about this species, but it is believed to roost in high cliff crevices and feed primarily on moths. Credit: USGS
📷3: Cave myotis - Found throughout the southwestern U.S., they feed on insects and form nursery colonies, usually numbering in the thousands, in caves, mines, barns, buildings, and sometimes under bridges. Credit: J Scott Altenbach, NABat
📷4: Indiana Bat - This small, insectivorous, migratory bat requires forests for foraging and roosting. They are found in forested areas in the eastern U.S. and hibernate in colonies in caves and mines in the winter. Credit: Dane Smith, NABat
#BatWeek
Something strange is haunting the coast.
Along the edges of rivers, marshes, and bays, stands of tall, gray, leafless trees rise from the water like skeletons. These are ghost forests, and they are as real as they are eerie.
Ghost forests form when saltwater reaches land once sustained by freshwater. As sea levels rise, saltwater moves farther inland, sometimes carried by storm surges and high tides. The trees slowly die, but their bleached trunks remain, while salt-tolerant marsh grasses quietly take over the ground beneath them.
These transitions are happening up and down the Atlantic coast. USGS scientists are studying them in several areas, including ongoing research on the Delmarva Peninsula in the Chesapeake Bay region. This region consists of several low sloped landscapes, which allows for rapid change to occur.
Here is where it gets even more mysterious.
Scientists drilled into the trees themselves to see what lurks inside. Living trees naturally take in and release gases, but little is known about how that changes once a coastal forest dies. A recent study, led by Hollins University with USGS as a coauthor, found that standing dead trees in ghost forests host microbes that convert methane, a potent greenhouse gas, into carbon dioxide, which is less potent.
It is one more piece of the puzzle as officials weigh the trade-offs of managing these landscapes. These ghostly trees may look lifeless, but they still have secrets to share.
📹: This ghost forest in Goose Creek State Park, North Carolina is an example of a freshwater forested wetland that is transitioning to open water. Credit: USGS.
#SpookyScience #GhostForest #ecology
Summoning the ghost of topographic maps past. 👻
From Death Valley to Pumpkin Hill, and every creepy, spooky, bone-chilling hollow, haunt, and graveyard in between, the USGS has been mapping the country since it was founded in 1879.
Every bend in a river tells a tale, every contour line has lore. Over the years, our methods for conjuring up topographic maps have changed, but the spells they cast remain just as potent today as back then.
We can’t guarantee these places aren’t haunted. 🎃
Explore these maps from the archives, if you dare - ow.ly/ZZ4t5100F8p
🗺️1: Death Valley National Monument, California as shown on Death Valley topographic map, 1956.
🗺️2: Tombstone, Arizona as shown on Benson topographic map, 1943.
🗺️3: Pumpkin Hill, Virginia as shown on Stony Man topographic map, 1933.
🗺️4: Devils Elbow, Missouri as shown on Devils Elbow topographic map, 2004.
#SpookyScience
USGS retweeted
World-class science. Extraordinary energy potential.
@USGS estimates 96 trillion cubic feet of undiscovered natural gas on Alaska’s North Slope. Interior science is helping reveal the resources that could power America’s future. doi.gov/pressreleases/usgs-r…
A creature is creeping through the Northeast, and it doesn't need a full moon to spread fear.
Meet the spotted lanternfly: a beautiful but invasive planthopper that's been haunting vineyards, forests, and backyards since it was first detected in New York City back in 2020. It doesn't howl or lurk in shadows, but its sneaky egg masses (disguised as harmless patches of dried clay) make it nearly impossible to spot until the damage is already done.
So how do you catch an invader this stealthy? Science, and a few very good dogs.
Researchers from the New York Invasive Species Research Institute, Cornell University, and the USGS New York Cooperative Fish and Wildlife Research Unit have teamed up with elite conservation dogs from the NY-NJ Trail Conference and Working Dogs for Conservation to sniff out egg masses that humans often miss. It's the first study to directly compare canine and human detection for this pest, and the results could help map where spotted lanternflies lurk and how to stop them before they spread further.
The mission isn't just about one bug. Protecting agriculture, forests, and local communities from this creeping menace could also help guard against the next invasive species yet to come out of hiding.
📷1: Left side of an invasive spotted lanternfly (Lycorma delicatula).
📷2: Canine scent detection dog sniffs out invasive spotted lanternfly at a vineyard in New Jersey.
Credit: USGS
#SpookyScience #lanternfly #InvasiveSpecies
A phone is more than just technology. It’s minerals, too.
Minerals are essential to the devices we use, the infrastructure we depend on and industries across the country. Getting those materials from the ground to the products we use, however, involves complex global supply chains.
USGS scientists track mineral production, demand and trade around the world. Where minerals come from, how concentrated their supply is and how easily supplies could be disrupted all help reveal potential risks to U.S. industries and the economy.
Each year, the USGS publishes Mineral Commodity Summaries, which brings together data on more than 90 mineral commodities across 180 countries. The report covers U.S. production, imports, exports, consumption and recycling, as well as global production, reserves, prices and market trends.
These data also help inform the Nation’s List of Critical Minerals, which identifies minerals essential to economic and national security that are vulnerable to supply chain disruptions. The 2025 list includes 60 mineral commodities.
The next time you pick up your phone, remember that the minerals inside it are part of a global supply chain. USGS science helps decision makers understand these connections and prepare for potential disruptions.
📸 1: Bastnaesite is a source of rare-earth elements used to produce magnets in speakers, microphones, and vibration motors.
📸 2: Chalcopyrite is a source of copper, the most abundant metal in a mobile device. Copper conducts electricity and heat, making it essential to electronics.
📸 3: Sphalerite is a source of indium and germanium. Indium is used in conductive coatings on smartphone screens, while germanium is used in displays and LEDs.
Credit: USGS
What lies beneath Crater Lake’s deep blue waters?
The caldera of an ancient volcano! This USGS geologic map reveals clues to Mount Mazama’s dramatic volcanic past, including the geology of the lake floor.
Mount Mazama began erupting about 420,000 years ago, building a massive volcano through repeated episodes of volcanic activity. About 7,700 years ago, a series of explosive eruptions caused its summit to collapse, forming the caldera that Crater Lake fills today. At 1,949 feet (594 meters) deep, Crater Lake is the deepest lake in the United States.
By mapping volcanic rocks, lava flows and eruption deposits across the landscape and on the lake floor, USGS scientists can reconstruct past eruptions, investigate how magma moved through Earth’s crust and better understand how large volcanic systems grow and evolve. This research also helps scientists evaluate volcanic hazards in the region.
As we near the end of Earth Science Week, celebrate Geologic Map Day by exploring the USGS National Geologic Map Database, where you can find this map of Crater Lake and thousands of other geologic maps: ngmdb.usgs.gov/
📸1: Portion of the Geologic Map of Mount Mazama and Crater Lake Caldera, Oregon.
📸2: Crater Lake and the surrounding landscape on a bright, clear day in August 2020.
Credit: USGS
#EarthScienceWeek2026
Behind every wildlife refuge is a story of science.
This National Wildlife Refuge Week, we’re celebrating how USGS science helps our U.S. Fish and Wildlife Service partners understand the needs of wildlife and the habitats they depend on.
📷 1: National Elk Refuge, Wyoming: USGS scientists evaluate how feeding strategies affect elk and bison gathering in groups, where diseases such as chronic wasting disease can spread. This research helps inform feeding decisions for approximately 8,000 elk and 500 bison that winter on the refuge and supports the long-term health of elk populations in the Greater Yellowstone region.
📷 2: Izembek National Wildlife Refuge, Alaska: Eelgrass meadows provide habitat for birds, fish and other marine life, as well as food that fuels black brant migrations. USGS tracks eelgrass abundance and distribution to help managers understand changes in this important habitat.
📷 3: Bayou Teche National Wildlife Refuge, Louisiana: USGS researchers are capturing, marking, and recapturing treefrogs to build a baseline understanding of their population. Since the refuge sits close to the Gulf, this data will help scientists understand how hurricanes and other natural disasters affect amphibians over time.
📷 4: Guam National Wildlife Refuge: USGS leads efforts to control the invasive brown treesnake, a species responsible for the loss of most of Guam's native birds and millions of dollars in damage to power infrastructure each year. This work protects native wildlife and helps prevent the snake from spreading to new islands, including Hawaii.
Credit: USGS
@USFWS
#NationalWildlifeRefugeWeek
Coral reef or satellite image? 🪸🛰️
If you guessed satellite image, you’re right!
This colorful view of the Lena River Delta in Russia is part of our Earth As Art collection, created using @NASA and @USGSLandsat satellite data.
The Lena River, at 2,800 miles long, is one of the largest rivers in the world. The Lena Delta Reserve is the most extensive protected wilderness area in Russia and is an important refuge and breeding ground for many species of Siberian wildlife.
For Earth Science Week, explore the full Earth As Art collection and discover more striking images that reveal our planet’s remarkable colors, textures and natural patterns from space 👉
ow.ly/2O1t50ZXmbT
#EarthScienceWeek2026
🐸 653 frogs. One big step for a species fighting its way back.
This summer, USGS scientists and partners released 653 critically endangered southern mountain yellow-legged frogs into their native habitat in Southern California, the largest release of the species to date.
These frogs are part of a larger effort to rebuild populations in the San Gabriel Mountains, where the species has faced threats from wildfire, drought, disease, non-native predators and habitat loss.
The work starts long before a frog reaches the mountains. Scientists and zoo partners rear tadpoles and froglets in captivity, then release them into carefully selected habitat. USGS researchers study the frogs after release to learn how they survive, grow and reproduce in the wild. That information helps scientists understand what it takes to establish healthy, self-sustaining populations.
With this summer's release, more than 1,000 mountain yellow-legged frogs have now been reared and released into the San Gabriel Mountains as part of this conservation effort.
It takes scientists, zoos and federal and state partners working together to give this endangered species a chance to recover.
📷 1: Endangered mountain yellow-legged frog (Rana muscosa).
📷 2: A newly released mountain yellow-legged frog.
📷 3: USGS biologists and partners climbing to a release site in the San Gabriel Mountains.
📷 4: Frogs in their transport containers waiting to be released.
Credit: USGS
#frogs #amphibian #SanGabrielMountains