

Data-driven visual content focused on global trends, investing, technology, and the economy. 📲 Creator on @VoronoiApp
Vancouver, BC
Joined August 2011
- Tweets17.7K
- Following3.3K
- Followers368K
- Likes2.3K




Ranked: Rule of Law in 41 European Countries in 2026 ⚖️
This graphic by The European Correspondent is one of the many incredible data-driven charts and stories from creators featured on our website. ✅
visualcapitalist.com/cp/rank…

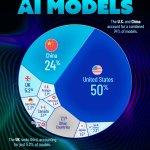
The Countries Developing the World’s AI Models 🤖
visualcapitalist.com/mapped-…

Ireland leads the world in ICT service exports at $301.7 billion, followed by India at $200.3 billion 💻
Created in partnership with @Adobe, this visualization highlights the top countries by information and communication technology service exports using data from the World Bank.
visualcapitalist.com/sp/adb0… #adb02

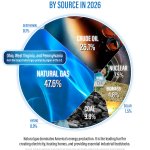
Natural gas and natural gas plant liquids account for 47.6% of U.S. primary energy production in 2026 YTD ⚡
Created in partnership with @ShaleCresUSA, this graphic shows America’s energy production by source using data from the EIA.
visualcapitalist.com/sp/sc02… #sc02

Mapped: Americans With No Net Wealth by State 💸
visualcapitalist.com/mapped-…

Mapped: How Much of Each Country Is Online? 🌐
This graphic by Iswardi Ishak is one of the many incredible data-driven charts and stories from creators featured on our @VoronoiApp. ✅
voronoiapp.com/technology/Th…

Ranked: The World’s Biggest Automakers, 2015 vs. 2025 🚗
visualcapitalist.com/ranked-…

The 25 Best Countries to Retire in 2026 (and How Much They Cost) 🏖️
visualcapitalist.com/ranked-…

Ranked: Countries That Use the Most of Each Fossil Fuel 🛢️
visualcapitalist.com/ranked-…

The U.S. attracted $285.9 billion in private AI investment in 2025, more than 23 times China’s total 🤖
Created in partnership with @TerzoHQ, this graphic ranks the countries attracting the most private AI investment as the global AI boom accelerates.
visualcapitalist.com/sp/ter0… #ter02
The Best Universities Outside the U.S. for 2027, According to 3 Rankings 🎓
visualcapitalist.com/the-bes…

Mapped: EU Countries by Government Debt (% of GDP) 💶
This graphic by Aneesh Anand is one of the many incredible data-driven charts and stories from creators featured on our @VoronoiApp. ✅
voronoiapp.com/debt/Mapped-G…

All the Metals the World Mines in a Year, Visualized ⛏️
From @VCElements—bridging the gap between global trends shaping our future, and the raw materials powering them ⚡️
elements.visualcapitalist.co…

Ranked: America’s Healthiest Cities in 2026 🌿
visualcapitalist.com/ranked-…

Ranked: The World’s Biggest Economies vs. Debt in 2026 💰
visualcapitalist.com/largest…

Since ChatGPT launched, eight AI giants accounted for 47% of the S&P 500’s total market cap growth 🤖
Created in partnership with @HarborCapital, this graphic measures market cap growth from November 30, 2022 to October 30, 2026 using data from S&P Global and TradingView.
visualcapitalist.com/sp/hc01… #hc01

Mapped: Average Salary by State in 2026 💰
visualcapitalist.com/mapped-…

Ranked: Which Countries Use the Most Oil Per Person? 🛢️
visualcapitalist.com/ranked-…

Sunday Digest 📊
Where does your salary stretch the furthest in 2026? What could the global economy look like in 2040? And which countries have the world's largest militaries?
Swipe through for some of this week's featured data stories.
📩 Want the full week in data? Subscribe to Visual Capitalist’s free daily newsletter to get our latest stories and visuals delivered straight to your inbox.
visualcapitalist.com/subscri…


Flashback Favorite 🔙
Mapped: Europe’s Population Crash (2025-2100P) 📉
From the Archive: visualcapitalist.com/mapped-…
