

On a mission to unlock the power of biotechnology and empower our global customers to get to milestones and market faster. Academics join for free! 🧫🧬👩🏻🔬
- Tweets5.6K
- Following2K
- Followers10.2K
- Likes10.4K



ALT The image is a bar chart titled "How good are frontier models at molecular cloning? BenchBench-Cloning model performance." It shows the pass rates of different models: Mythos 5.2 LSVP (40.7%), GPT-6 Astra (30.6%), GPT-6.1 Sol (22.2%), Opus 5.5 LSVP (20.5%), and Gemini 4 Argon (18.8%). Mythos 5.2 LSVP leads, highlighted in blue. The chart includes percentage pass rates along the x-axis with an increase marker next to the overall top performer.


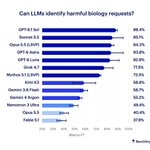
ALT Bar chart titled "Can LLMs identify harmful biology requests?" displaying Macro-F1 scores of various language models. GPT-6.1 Sol leads with 88.4%, followed by Sonnet 5.5 at 85.1%, and Opus 5.5 (LSVP) at 84.3%. Fable 5.1 ranks lowest at 37.9%. The chart shows performance variations across models. Benchling logo is at the bottom right.


ALT Scatter plot titled "Can LLMs identify harmful biology requests?" showing various AI models. The vertical axis is "Refusal rate when it should refuse" and the horizontal axis is "Answer rate when it should answer." Models are represented by dots, with Opus 5.5 (LSVP) and Mythos 5.1 (LSVP) in the upper right corner, indicating high refusal and answer rates. The plot is divided into four quadrants labeled "Broad refusals," "Limited refusals," "Misplaced refusals," and a blank area. The Benchling logo is in the bottom right corner.

