





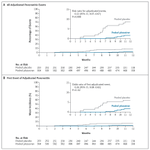




ALT The image contains six graphs. Graph A: The cumulative incidence of four-component primary end point of major adverse cardiovascular events (MACE) on treatment. Graph B: The cumulative incidence of three-component MACE on treatment. Graph C: The cumulative incidence of three-component MACE on treatment for composite of nonfatal MI, urgent coronary revascularization, or coronary heart disease (CHD) death. Graph D: The first and total_MACE events. Graph E: The cumulative incidence of the four-component MACE primary end point in landmark analysis with stratification of the pelacarsen group by lipoprotein(a) reduction after 3 months of treatment greater than or equal to and less than the median (170 nmol/l). Graph F: The cumulative incidence of the four-component MACE primary end point in landmark analysis with stratification of the pelacarsen group by achieved lipoprotein(a) after 3 months of treatment less than or equal to and greater than the median (69.5 nmol/l).


ALT The image features a quote: "I believe that patient selection will be essential in identifying those who would be most appropriate for the medication." Jennifer Rose V. Molano, M.D., reviewing Dauvilliers Y, et al. Oveporexton for narcolepsy type 1 — Results from two phase 3 trials. N Engl J Med 2026 Sep 24 The quote appears on a gradient blue background with the NEJM Clinician logo at the bottom.

ALT The image contains six graphs. Graph A: The cumulative incidence of four-component primary end point of major adverse cardiovascular events (MACE) on treatment. Graph B: The cumulative incidence of three-component MACE on treatment. Graph C: The cumulative incidence of three-component MACE on treatment for composite of nonfatal MI, urgent coronary revascularization, or coronary heart disease (CHD) death. Graph D: The first and total_MACE events. Graph E: The cumulative incidence of the four-component MACE primary end point in landmark analysis with stratification of the pelacarsen group by lipoprotein(a) reduction after 3 months of treatment greater than or equal to and less than the median (170 nmol/l). Graph F: The cumulative incidence of the four-component MACE primary end point in landmark analysis with stratification of the pelacarsen group by achieved lipoprotein(a) after 3 months of treatment less than or equal to and greater than the median (69.5 nmol/l).


ALT The image is a page from a publication titled "The IQEPS Model for Lean Hospital Facility Management: Standardization, Closed-Loop Repair, and Safety Governance During Multicampus Growth." It includes a framework diagram with four interconnected circles labeled Intelligence, Quality, Safeguard, and Effectiveness, surrounding a central circle labeled IQEPS Model for Lean Hospital Facility Management. Each circle contains brief descriptions of goals and functions, such as automation and standardized procedures. Above the image is the article type: The page also mentions NEJM Catalyst and the Massachusetts Medical Society.

ALT An image from a Morning Report published in NEJM Evidence article titled " A 58-Year-Old Woman with Abdominal Pain, Fever, and Cough." The image shows computed tomography of the abdomen (coronal view). The NEJM Evidence logo sits at the bottom.


ALT A graph from an Original Article published in NEJM Evidence article titled "Next-Generation Bed Nets to Control Malaria in Côte d’Ivoire." The graph shows malaria case incidence in children over 12 months. The NEJM Evidence logo sits at the bottom.


ALT Cover of the November 2026 issue of NEJM Evidence with "Read the latest issue" above it.


ALT A quote from a Perspective published in NEJM AI reads as follows: "The danger is not that trainees will use AI. The danger is that they may never learn what it feels like to reason before AI intervenes.” The Perspective is titled “No Mastery without the Machine — Medical Education in the Age of Clinical AI” and the authors are P. Jarrett et al. The background color is an orange-yellow gradient and includes the NEJM AI logo.


ALT A line graph depicting the age-adjusted incidence rate of colorectal cancer per 100,000 from 2000 to 2023. The graph has data points marked in gray, orange, blue, and red for different time periods. The time periods are 2000–2008, 2008–2012, 2012–2021, and 2021–2023, each with the respective annual percentage changes (APC) and 95% confidence intervals.

ALT A graph from the Original Article "Tarlatamab–Durvalumab Maintenance for Extensive-Stage Small-Cell Lung Cancer." The trial name, DeLLphi-305, is in parentheses after the title. The graph shows the overall survival (intention-to-treat population). The trial results are being presented at the European Society For Medical Oncology 2026 Congress. The logo of the New England Journal of Medicine is at the bottom.

ALT This image displays a maximum likelihood phylogenetic tree of measles virus whole-genome sequences. The tree shows branches representing different mutations compared to the root clade. Various points are marked in different colors to indicate the origins: County A, County C, County D, and South Carolina.